This is a project done by John Kim, Jeff Schecter and Michael Nussbaum for EECS 349 — Machine Learning taught by Professor Downey at Northwestern University.
Our goal was, given the posts of a close community of twitter users up to day i, to predict the frequency of words in that community’s posts on day i+1. Current methods that measure trending or popular topics do not always accurately represent the most talked about subjects. Instead of focusing on raw frequency data, we incorporated additional attributes derived from the social network of community members – a user’s followers and friends, their followers and friends, and so on. A tightly-knit community, i.e. one where users are friends and followers of each other, would better transmit ideas from one person to another, thus ensuring a wider spread of information. The results of the project have many different applications, such as following the emergence of news trends, better targeting for advertisers, and exploring the spread of novel linguistic forms.
To gather a tightly knit community of twitter users we started with a single tweeter and began pulling new users who were highly connected to the community so far. To be included in the population, a user must have fewer than 5000 friends (to avoid celebrities and robots), and have tweeted at least once on each of the past two days. This ensured that we gathered a representative and balanced community. We ended up with a 200 person training community based on Twitter user lizardbill and a 199 person testing community based on davechapman. The close-knit communities allowed us to include a network analysis inspired by Google PageRank in our calculations.
For the machine learning portion of our project each instance represented one word tweeted in our population up to day i. We tried to learn the frequency with which the word is mentioned on day i + 1. To this end we calculated attributes based off of the tweets of our users and off of the word statistics provided by the Hoosier machine readable dictionary. Specifically, our attributes were: frequency on day i, frequency day i – 1, total frequency within community through day i, frequency given in the Hoosier database, familiarity rating given in the Hoosier database, whether the word is in the Hoosier database, whether the word is a hashtag, whether the word is an @reply, and expected readings (from the network analysis).

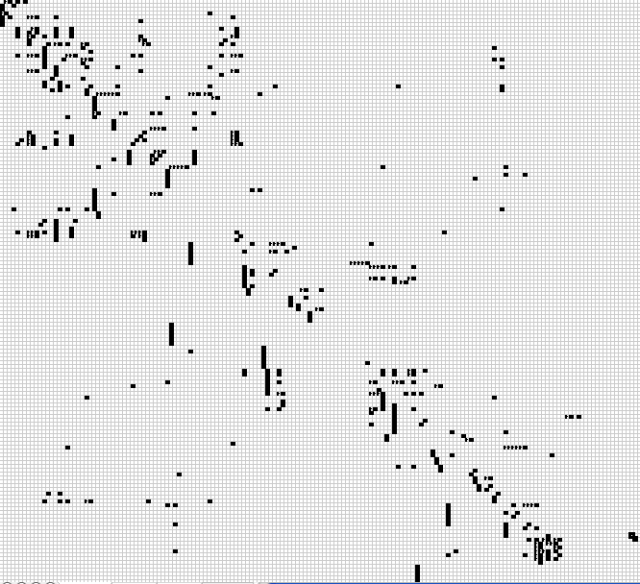
Connections within lizardbill community. A black square indicates that the user represented by the column follows the user represented by the row.
We used support vector machines, specifically LIBSVM 3.0 to determine our predicted word frequencies. We tried using several combinations of kernel and svm type, with and without network analysis, for a total of 16 different permutations. In almost every case network analysis improved results and in all cases our predictions fared better than the baselines — our first baseline was the average frequency of every word on day i + 1 and our second baseline considers the frequency of each word on day i + 1 the same as the frequency of the word on day i.

squared correlation coefficients and mean squared errors by svm parameters -- highest coefficients with and without network analysis are highlighted

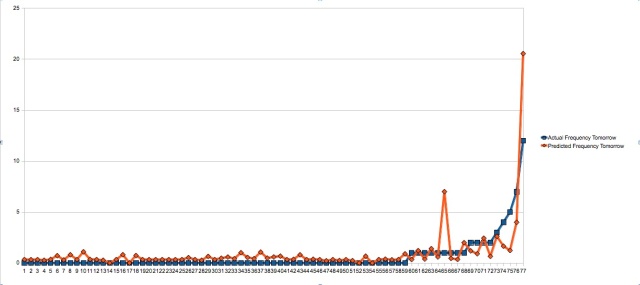
a 1% subset of words arranged in ascending order of frequency on day i + 1, observed and predicted frequencies on day i + 1 on y-axis
For further information and details, feel free to read our full project report and check out our code base.
We can be contacted at twitterpredictor at gmail dot com.
